Why did we map out the Home Energy Score in Portland? We wanted to be able to share with Realtors, and their Clients, what the average Score rating is within each neighborhood. As the H.E.S. program progresses people are becoming more aware of the fact that neighborhoods tend to have a common “Score” within them. For example; if your East Portland home was built in 1947 (say near N.E. 61st Ave.), then likely the majority of the nearby homes were also build around that same time frame. Similar construction styles were taking place, building codes were the same, and design/layout is even likely to have much in common. It’s the upgrades that set these homes apart today, such as the installation of vinyl windows or the fact that one of the home owners added insulation in the walls and attic. However, overall many of the home haven’t change much from when they were built (other then perhaps a new water-heater, or a furnace upgrade).
As a Real Estate Broker, or a Homeowner, you are well familiar with the community that you work or live in, the housing prices, and the number of homes that might be for sale in your neighborhood today. But, do you know your community’s average Home Energy Score?
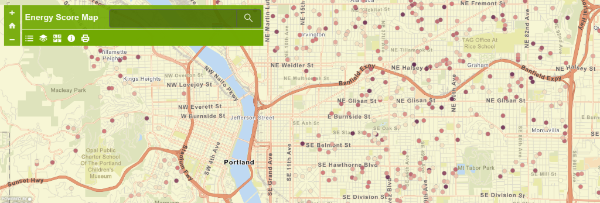
Follow this link https://www.homeenergyscore.com/map/ to find out how your Home compares to others that sold near you.